

Authors /
Tatul Hayruni
Naneh Hovanessian
Edgar Hovhannisyan
Lusine Torosyan
Abstract
This report examines regional disparities in Armenia, with a particular focus on the widening gap between Yerevan and the rest of the country’s regions. Among several factors, we focus on the financial and institutional drivers. Using a spectrum of socio-economic, financial, and governance indicators, our study highlights the idea that regional inequality is significantly reinforced by the concentration of employment, credit, and public resources in the capital. Limited effective access to finance in the regions, combined with a predominantly centralized fiscal governance setup and weak local revenue capacity, constrain investment and job creation outside the capital, Yerevan. These financial and institutional constraints contribute to outward migration, losses in human capital, and widening productivity differences across regions. Our findings suggest that addressing regional disparities in Armenia requires targeted interventions to reduce structural drivers of out-migration from the regions and create a more favorable environment for long-term local productivity growth. To achieve this, we propose a combination of policy actions and guiding principles, including targeted financial instruments, stronger local fiscal capacity, and institutional reforms that support region-based development.
Background
Regional disparities exist almost everywhere, in both developed and developing countries. Only a handful of developed states can claim to have relatively balanced living standards across their regions. For instance, OECD’s regional well-being reports often mention Austria, Denmark, Norway, and a few others as positive cases. The rest still search for policies that can bring some equality and narrow the gaps. These differences matter even more for small and developing economies, as they shape social conditions, long-term productivity, and, in some cases, even border security.
Armenia is a textbook example where all these factors come together. A strong capital city coexists with economically weaker regions, creating constant demographic and economic pressure. While this gap existed even during Soviet times, when the economic system was designed to ensure a more even distribution of resources, most regions and regional centers were, to a certain degree, self-sufficient in providing education, healthcare, and other services to local communities, and the quality was comparable to that of Yerevan. Since independence, and with a fundamentally different economic model, this gap has only widened, as both human and physical capital gradually moved away in search of sustainable income. As a result, many regional towns and villages are shrinking due to aging populations, low capital accumulation, and lower productivity. This may lead to a self-reinforcing cycle: migration reduces scale, businesses suffer, people lose jobs, and a new wave of migration becomes more likely.
Geographical and broader forms of disparity are a common socio-economic challenge across many countries worldwide, with several interconnected dimensions. In this paper, we primarily focus on the economic and financial perspectives.
It is useful to begin with how regional variance is measured. At first glance, quantifying disparities among regions seems straightforward. We can choose one of the standard indicators, such as GDP per capita (see Table 1 in the Appendix), wages, and unemployment, and assume that the issue is adequately captured. However, each of these compresses a multidimensional reality into a single number, often hiding complex dynamics underneath. A region may appear “rich” per capita or outperform others in terms of overall economic growth, driven by a few industrial giants. Yet it may suffer from weak social conditions or high out-migration.
Another approach is to examine readily available indices, such as the Human Development Index (HDI), or to select a set of indicators encompassing social, economic, infrastructure, and other aspects of regional development, and manually combine them to construct our own composite index. The latter, however, introduces its own challenges: first, there is no universally accepted approach for assigning meaningful weights to each component. Second, in Armenia and other countries alike, there are typically multiple data gaps at the regional and granular microdata levels. These gaps are usually filled by heavily using interpolation or extrapolation techniques, which significantly lowers the quality and reliability of the overall index.
Finally, there are also alternative methods for evaluating regional disparities. One option is to focus on single indicators, such as regional real estate prices (See Table 3 in the Appendix). While this is only one measure, it reflects the preferences and choices of many people. Housing prices tend to incorporate how people assess living conditions in a region, including access to services, infrastructure, education, security, and job opportunities. In this sense, a single indicator captures a wide range of underlying factors related to a region’s or city’s perceived level of development. At the same time, the weight of each factor is naturally and implicitly derived from the preferences of people, thereby eliminating the need for manual assignment.
Another interesting alternative for assessing regional disparities is to rely on satellite imagery, particularly data capturing nighttime lights. In macroeconomic research, this technique is mostly used to refine regional and overall GDP estimates and nowcasts. In our context, the basic idea is that the intensity of artificial light observed from space can serve as a proxy for economic activity and human presence. Areas with higher income levels, denser economic activity, and better infrastructure tend to emit more light at night, while poorer or less developed areas remain darker. Using annual nighttime light data derived from the VIIRS sensor, we compare changes in light intensity across regions over time. The results point to a familiar pattern: most of the increase in nighttime brightness is concentrated in Yerevan and its surrounding areas, while regional centers exhibit only modest gains. This is clearly illustrated in the right panel of Figure 1, which shows the difference in average annual nighttime light intensity between2012 and 2021.
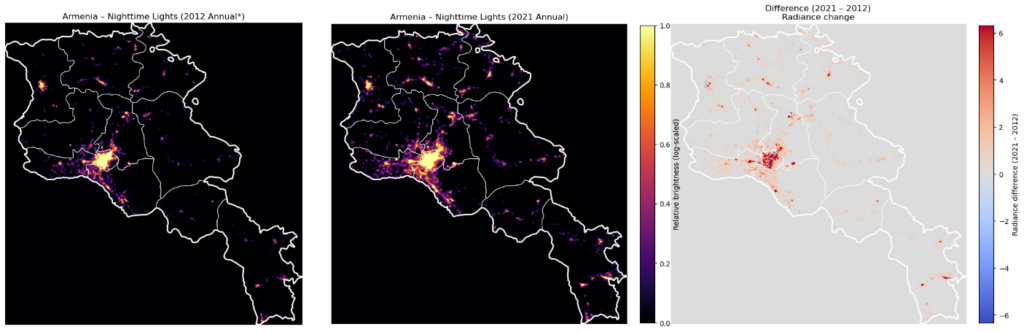
Figure 1. Average annual nighttime light in Armenia (left: 2012, middle: 2021, right: radiance difference from 2012 to 2021). Source: NOAA Earth Observation Group (VIIRS Day/Night Band annual composites).
Given the variety of approaches, we believe it is best to monitor a range of indicators in parallel and, depending on the specific question at hand, prioritize those that are most relevant. Importantly, one principle on which many researchers agree is the need for consistency: whatever measure is used to design policy should also be used to evaluate its impact. In line with this approach, we look at several socio-economic indicators in parallel during the analysis.
Once we move beyond the question of “how to measure,” the next natural step is to understand what might be driving regional differences and where they originated from in the first place. The economic map of Armenia we observe today did not appear suddenly. It is the cumulative result of a few decades of uneven development. Disparities between regions and the capital, Yerevan, are not merely numerical gaps; they reflect deeper patterns rooted in geography and the historical evolution of the economic structure. A brief look back at the early 1990s helps explain how regional differences emerged early in the decade. The collapse of production chains, the shutdown of industrial sites, and the energy crisis created uneven starting points for the regions. Some regions lost their productive industrial capacity in a matter of months, while others quickly shifted towards agriculture. Border and mountain areas were hit the hardest, facing insecurity, weak connectivity, and out-migration that continued for years. These early differences proved to be persistent: once a region loses its scale, capital, and skilled labor, rebuilding becomes extremely difficult. These early conditions also influenced how regions responded and utilized economic opportunities once economic growth resumed.
During the 2000s, despite strong macroeconomic growth, these initial gaps did not shrink. In fact, the main engines of growth, such as construction, services, and later IT, moved heavily towards Yerevan. Investment also concentrated there, partly because the capital offered larger markets and better institutional access. Some regions benefited from specific characteristics, such as Syunik’s significant mining potential, but many others remained on the sidelines. This partly explains why broad national growth figures often do not translate into visible improvements in many regions.
Over time, these structural differences have been reinforced rather than reduced. Population decline in Armenia has followed a clearly uneven spatial pattern, with some regional centers holding on due to specific job opportunities or location advantages, while many less-populated areas and settlements continue to shrink. Regions with poor accessibility or limited economic opportunities are particularly vulnerable. These trends matter not only demographically but also economically, as shrinking local markets struggle to sustain basic services, businesses, and municipal capacity.
At the same time, the overall regional structure has remained largely unchanged despite reforms and some periods of growth. Regions with extractive or industrial capacity had something to build on and adjusted faster, while others, especially those dependent on low-productivity agriculture, made limited progress. Yerevan’s advantages continued to accumulate through agglomeration effects, institutional concentration, and better connectivity, reinforcing its role as the main economic magnet. As a result, regional disparities are not temporary or abstract. They translate into concrete differences in jobs, mobility, and human capital (For example, see Table 2 in the Appendix for the Human Development Index). In the next section, we examine the data and evidence to see how these gaps manifest in employment patterns, migration, and access to skills.
Socio-Economic Consequences: Employment, Mobility, and Human Capital Gaps
Employment Concentration and Labor Mobility
One of the most visible ways regional inequalities materialize is in employment dynamics. In recent years, there has been significant job growth and concentration in Yerevan, contributing to much of the new job creation, particularly in services, IT, and finance, whereas most regions remain poorly served. Work opportunities outside the capital are scarce, and many individuals are tied up in low-efficiency agriculture or informal work.
Rates of official unemployment vary significantly from region to region (Figures 2 and 3): from seemingly low levels in some remote areas, which may reflect out-migration or non-registration rather than robust labor markets, to persistently high levels in others. Notably, the data also indicates a convergence of job seekers and the unemployed in each region.
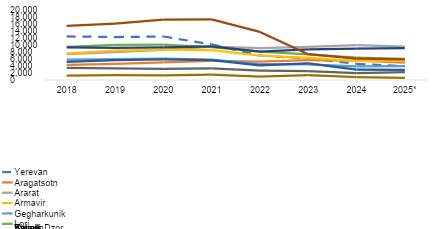
Figure 2. Number of Job Seekers by regions, person. Source: Statistical Committee of RA.
However, the convergence must not be seen as an equalization of the labor market conditions at the regional level. It rather indicates the population and labor force outflow away from the regions, such as toward Yerevan, which mechanically reduces the number of registered unemployed and job seekers outside the capital. Limited local job opportunities in the regions stimulate labor mobility through migration. Young adults leave regional labor markets in search of employment opportunities in Yerevan or abroad. This rural-to-urban and international migration has been a defining feature of Armenia’s demographic dynamics, as nearly all borderline and remote communities have experienced low population growth.
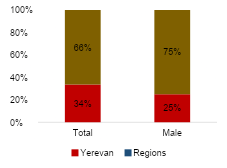
Figure 4. Deregistration in Yerevan and regions in 2024, all age groups. Source: Statistical Committee of RA.
Figure 4 shows deregistration patterns across regions in 2024. Although 34 percent of all deregistered persons are in Yerevan, most are outside the capital, suggesting the extent of population withdrawal from the area. This trend is even more evident among men: one in four deregistered males is from Yerevan, meaning that three-quarters of male deregistrations occur in the regions. Given that men are more likely to migrate for work, this strongly suggests that regions are the primary source of labor out-migration.
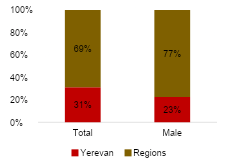
Figure 5. Deregistration in Yerevan and regions in 2024, for individuals aged 15-63. Source: Statistical Committee of RA.
Additionally, Figure 5 focuses on the working-age population (ages 15-64). Among working-age men, only 23 percent are deregistered in Yerevan, indicating that deregistration is concentrated in the regions. This underscores a disproportionate migration of economically active people from local labor markets.
Importantly, these numbers take in only part of the migration process. Many migrants, especially those who come to Yerevan for work, do not update their registration in the national system, particularly when they migrate temporarily or if their housing conditions are uncertain. This means that deregistration data will probably underestimate the real magnitude of labor-driven migration from the regions. The consequences are twofold. On the one hand, regional out-migration mechanically reduces unemployment in the region. At the same time, it reduces the regional labor force, exerting direct pressure on working-age human capital, which is essential for regional productivity growth and long-term regional development.
Human Capital and Quality of Life Disparities
Regional economic disparities translate into persistent gaps in human capital formation and quality of life. Although most of Armenia has access to elementary and secondary education and healthcare facilities in cities, significant differences in quality and access to these services remain. The real problem in education isn’t access, it is quality. In Yerevan and the regions, children can enter school. However, rural schools often have limited resources, poorer social and physical infrastructure, and face challenges in recruiting and retaining qualified teachers. Consequently, the level of education or skills attained varies significantly across regions and in Yerevan. Students in the capital benefit from better-equipped schools and a wider range of academic opportunities, while many rural schools have limited resources and declining enrollment. Over time, these disparities contribute to selective migration and brain drain, in which more talented and motivated students from the regions move to Yerevan for higher education, progressively “emptying” regional schools and further weakening local education systems.
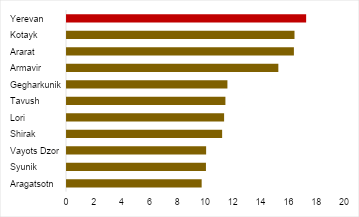
Figure 6. Number of students per teacher by regions in 2024. Source: Statistical Committee of RA.
Figure 6 illustrates these dynamics through the number of students per teacher in 2024. Yerevan has the highest student–teacher ratios, which, when everything else is held constant, must be seen as a disadvantage. However, in this context, the trend highlights recurring inflows of students into Yerevan’s schools, driven by perceived and actual quality gaps, alongside declining enrollment in regional schools. Rather than signaling overcrowding alone, the figure highlights the gradual decline of the education system in the regions as students migrate toward the capital.
Education-related migration reinforces income inequality. Research indicates that additional years of education are strongly correlated with higher earnings. Today, better-off households, which are disproportionately concentrated in Yerevan, tend to have higher educational attainment. This creates a vicious cycle, resulting in better education, higher income, and better opportunities being further geographically concentrated in the capital.
There is a similar disparity in healthcare infrastructure as in education. The capital, home to many large hospitals and many specialized clinics, has far more hospitals per capita than the rest of the country. Figure 7 compares each region’s population share with its hospital share. Yerevan is located below the 45-degree line, where the proportion of hospitals exceeds the population. This clearly shows a disproportionate concentration of healthcare infrastructure in the capital. As a result, residents outside Yerevan face more limited access to hospital-based care.
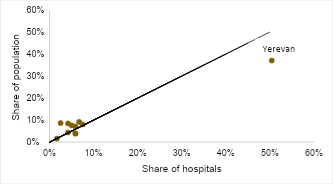
Figure 7. Share of population vs share of hospitals by regions in 2024. Source: Statistical Committee of RA.
Figure 8 reinforces this finding by illustrating the number of people per doctor across different regions. Yerevan has by far the lowest population-to-doctor ratio, so residents of the capital have significantly easier access to healthcare workers than people in the regions. High ratios elsewhere, by comparison, indicate doctor shortages and longer workloads, which can diminish the quality and timeliness of care.
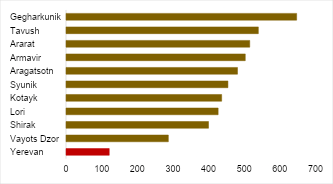
Figure 8. Number of people per doctor in 2024. Source: Statistical Committee of RA
These disparities in healthcare availability and quality translate into tangible differences in quality of life. Together with gaps in education and other public services, they influence household location choices, encouraging families to relocate to Yerevan in search of better healthcare, schooling, and overall living conditions. Over time, this strengthens internal migration patterns and deepens regional imbalances.
Inter-Regional Productivity and Output Divergence
One of the most consequential effects of regional disparities is the widening productivity divergence between Yerevan and the rest of the country. The capital’s economy is increasingly oriented towards high-value-added sectors, such as finance, IT, and advanced services, while many regions remain dependent on low-productivity agriculture or resource-intensive, high-cost activities like mining.
Figure 9 depicts this divergence through average monthly wages as a ratio of Yerevan’s levels in 2008 and 2024. Wages have fallen relative to capital across all regions, indicating that income growth was concentrated in Yerevan and that regional wages are falling behind. This divergence is a result of differences in sectoral composition, productivity, and local economies’ capacity to generate higher-paying jobs.
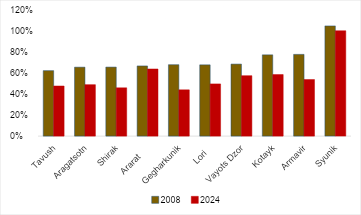
Figure 9. Average monthly wage (% of Yerevan) by region. Source: Statistical Committee of RA
Poverty trends over 2018-2023 are depicted in Figure 10. Most regions that were relatively poor in 2018 experienced further deterioration by 2023, suggesting economic growth has been uneven and regional development gaps persist. These trends perpetuate income differential between capital and the rest of the economy: workers in Yerevan not only earn more but also contribute to higher aggregate output due to the concentration of higher-productivity sectors.
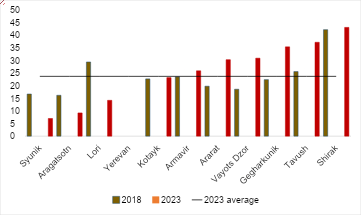
Figure 10. Poverty dynamic in regions, %. Source: Statistical Committee of RA.
Migration is driven by unequal employment opportunities, which in turn drains human capital from the regions that need it most. Diminished human capital, combined with a weaker infrastructure and services in these regions, reduces local productivity and constrains wages and job creation. Over time, this self-reinforcing cycle perpetuates disparities in welfare, as evidenced by employment, education, and health outcomes between Yerevan and the rest of Armenia.
Financial Drivers of Disparities
One key dimension of regional disparities in many countries is access to financial resources. Armenia is not an exception. This encompasses not only the volume of credit available but also the physical and institutional infrastructure that enables financial inclusion, such as the geographic distribution of bank branches, ease of access, and ATM and service point density.
In Armenia, Yerevan stands out disproportionately across all these indicators. Whether measured in absolute credit volumes, number of branches, or even ATM penetration, the capital significantly outperforms every other region. A similar pattern emerges when examining growth dynamics over time. In absolute terms, the only region that comes close is Kotayk, which has experienced a notable lending boom over the past three years, likely driven by its proximity to Yerevan and the reorientation of demand following the phase-out of the income-tax mortgage subsidy program in the capital. However, when considering per capita loan levels, the rest of the regions are divided into two groups: Kotayk, Syunik, and Vayots Dzor extended significantly more loans over the previous several years than the rest of the country (Figure 11).
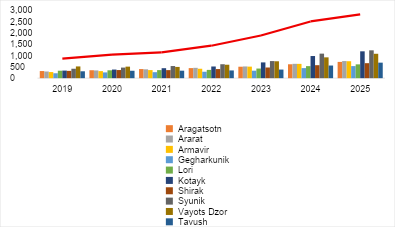
Figure 11. Loans to residents by region (per capita, mln AMD). Source: Central Bank of Armenia, Statistical Committee of RA.
When considering credit activity, particularly in foreign-currency-denominated loans, Syunik exhibits performance that is not significantly different from Yerevan (Figure 12). While the gap over the last three years has widened somewhat, per capita FX loans to Syunik are much higher than in the other regions. This trend appears to be linked to a small number of large loans extended to mining companies operating in the area, highlighting how sector-specific developments can strongly influence regional financial outcomes.
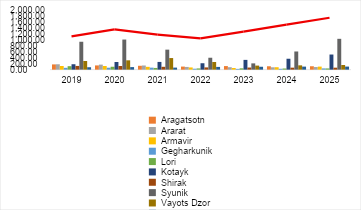
Figure 12. FX loans to residents by region (per capita, mln AMD). Source: Central Bank of Armenia, Statistical Committee of RA
The overall picture remains largely unchanged when examining the sectoral composition of regional loans. Yerevan maintains the highest share of lending across all sectors, except mining, where Syunik accounts for 45% of national mining loans, compared to Yerevan’s 41%. Remarkably, Yerevan also dominates agricultural lending, holding roughly 60% of the total: an indicator of how concentrated financial activity is in the capital despite agriculture being a predominantly rural sector (Figure 13).
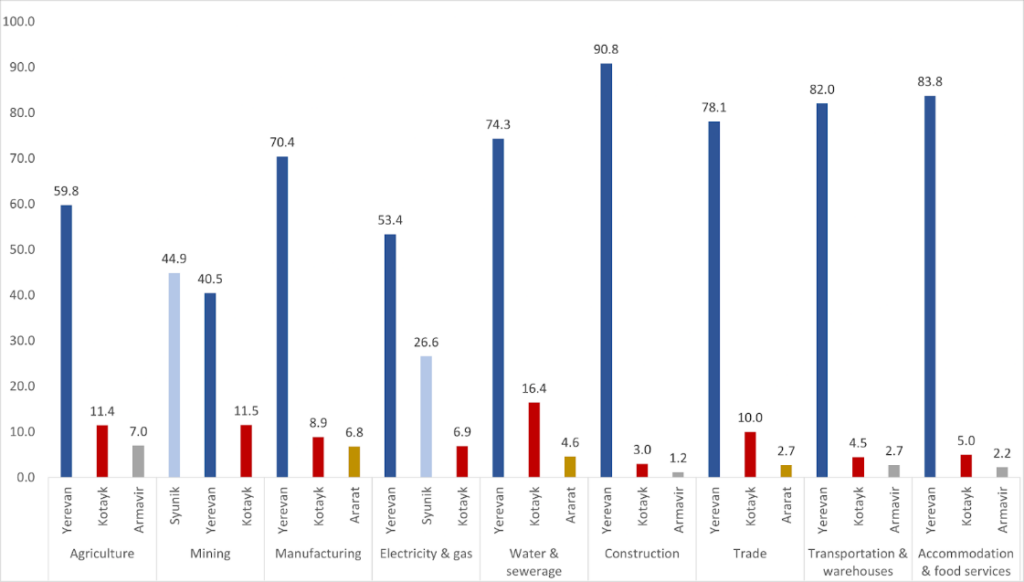
Figure 13. Top 3 regions by loan shares (by industry). Source: Central Bank of Armenia
Looking at the sector-wise distribution within Yerevan, the largest shares are in construction and trade, at approximately 27% and 20%, respectively (Figure 14).
In contrast, several regions, specifically Aragatsotn, Ararat, Armavir, and Gegharkunik, exhibit a distinctly different profile, with agriculture accounting for the largest share of their loan portfolios. Agriculture lending is also relatively high in Lori, Kotayk, Shirak, and Tavush, although it is not the single dominant category in these regions. Trade plays a particularly important role in Lori, Kotayk, and Shirak, accounting for 23-31% of loans.
Tavush stands out as the most evenly diversified region, with agriculture, construction, trade, restaurants, and accommodation each making up roughly equal shares, averaging around 17%. This balanced distribution suggests a more homogeneous economic structure compared to other regions.
Beyond mining, Syunik also has a substantial share of loans in the utilities sector, where its portfolio is comparable to that of Vayots Dzor (37% and 44%, respectively). Vayots Dzor further resembles the capital in terms of construction lending, with construction loans constituting 25% of its portfolio, compared to 27% in Yerevan.
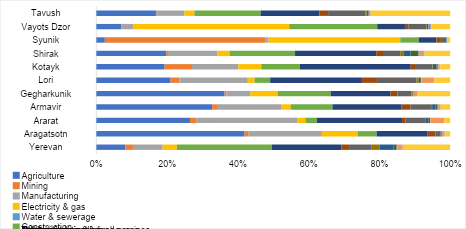
Figure 14. Industry loan shares across regions. Source: Central Bank of Armenia.
According to the 2024 World Bank Enterprise Survey, access to finance remains a major constraint for firms across Armenia, both in Yerevan and in the regions (Figure 15). However, the severity of this obstacle varies markedly. While around 21% of firms in Yerevan identify access to finance as their main barrier to business operations, this share rises to approximately 55% in the northern regions (Shirak, Lori, Tavush) and stands at 34% in the rest of the country.
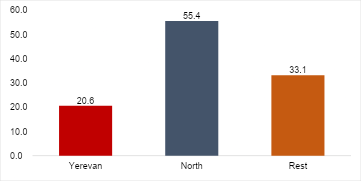
Figure 15. Firms reporting access to finance as their major obstacle (%, by region). Source: World Bank Enterprise Surveys, www.enterprisesurveys.org.
However, in some regions, this appears to be due to firms’ perceptions and reluctance to apply for loans, rather than to barriers to financial services or supply issues. Firstly, across all regions, the share of firms holding savings or checking accounts is consistently high, ranging from 86% to 95%, with the lowest in the north and the highest in Yerevan, which indicates that firms in all the regions have access to basic financial services and are familiar with banking institutions. Similarly, access to formal credit is not extremely uneven: around 51% of firms in Yerevan have a loan or credit line, compared with about 46% in both the northern regions and the rest of the country.
To determine whether the issue of access to finance is related to a lack of collateral or the inability to attract large business loans, we examined the loan-to-collateral ratios of firm-level loans across regions. While this indicator has comparable means across regions and industries (manufacturing, retail, and other services), overall distributions show some differences (Figure 16). While the average in Yerevan is lower than in the North, there are more loans with higher loan-to-collateral ratios in Yerevan than in other regions. In the North, the average is high, mainly due to the presence of large firms; however, the ratio of small enterprises is similar to that in Yerevan. Firms in the rest of the country, according to this data, have on average lower loan-to-value ratios, which, given the absence of the mining sector in the World Bank data, which is the main sector operating in the south of the country, can be explained by the issues related to access to finance.
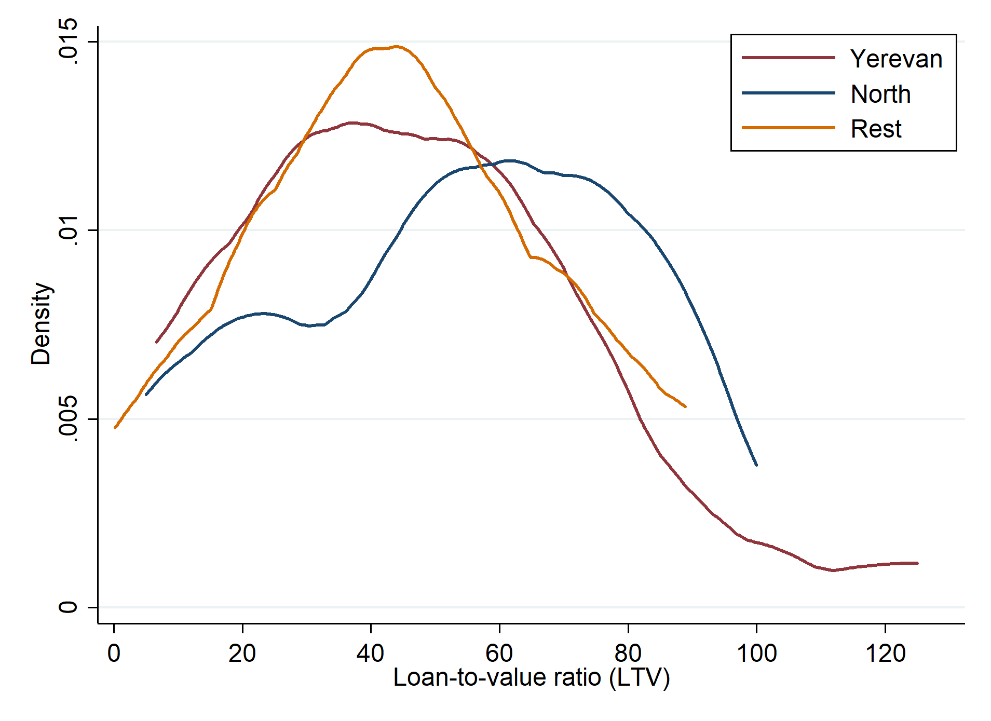
Figure 16. Distribution of loan-to-collateral ratios across regions. Source: World Bank Enterprise Surveys, www.enterprisesurveys.org.
This hypothesis is somewhat confirmed by the reasons firms choose not to apply for loans. In Yerevan and the northern regions, most firms – 57% and 61%, respectively- report that they simply do not need a loan. In contrast, only about 36% of firms in the rest of the country cite a lack of need. Instead, high interest rates and the perception that loan applications would be rejected emerge as the dominant reasons for not seeking credit, indicating that the issue can be twofold, stemming from both demand and supply.
Institutional and Governance Factors
Armenia ranks among the most centralized unitary states, with local governments exercising very limited control over tax bases, rates, and revenue administration. As for comparing the degree of fiscal decentralization, we can see in the graph below that Armenia is among the most fiscally centralized countries, where local budget taxes make up only 2.2% overall tax receipts. Figure 17 illustrates this broad comparison, showing that Armenian local governments rely on central government transfers for nearly 80% of their funding.
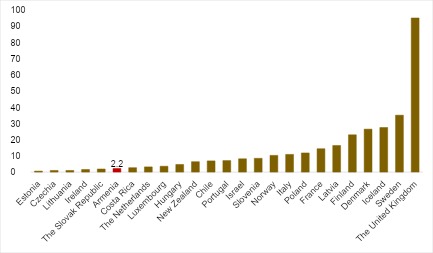
Figure 17. Degree of Fiscal Decentralization in 2022 by Country. Source: Grigoryan et al. 2025.
Regional disparities in Armenia stem from the reliance of local and regional authorities on central government grants. The data indicate that local governments rely largely on these transfers from the central government, and taxes and duties account for only a small percentage of their total revenue (approximately 17% for marzes (regions)). As official transfers (grants) constitute a significant portion of local revenue, this gives regions little autonomy in fiscal policy. This financial dependency severely limits local governments’ ability to make independent decisions on spending priorities, as these funds are predominantly allocated by the central government.
The following graph illustrates the substantial disparity in revenue generation between Yerevan and other regions, particularly in terms of taxes and duties. Yerevan’s developed tax base enables it to generate a greater proportion of revenue locally, whereas the regions remain highly dependent on central government transfers.
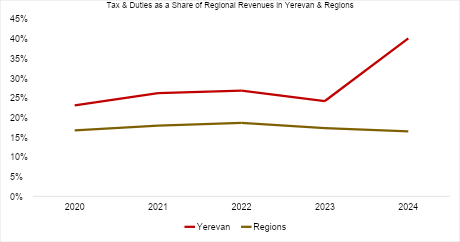
Figure 18. Tax & Duties in Local Budgets. Source: Statistical Committee of Armenia, Yerevan Municipality & Authors’ calculations.
For Yerevan, taxes and duties became a growing key source of revenue, increasing from 23.08% to 40.13% of total revenues from 2020 to 2024. This pattern is part of the more diversified and vibrant economic structure of the capital, characterized by an abundance of businesses and industries and high-income residents. In turn, Yerevan has strengthened its fiscal controls and become able to finance local projects, infrastructure, and services with less reliance on central government handouts.
On the other hand, regions depend quite heavily on government grants, with taxes and duties contributing a lower and less stable share of total revenues, ranging from 16.75% to 18.65% over the same period. A limited local tax base restricts regional governments’ ability to independently finance and mobilize necessary investments for projects and respond to local development needs, thereby reinforcing their dependence on centrally allocated resources and constraining their independence in fiscal and developmental policymaking.
Low regional tax revenue has crucial implications for regional development and governance. First, limited local revenue generation significantly reduces fiscal autonomy; regional governments must now rely on the central transfer system without the ability to make independent budgetary decisions. This dependency restricts the flexibility of resource allocation and weakens local authorities’ ability to respond effectively to local needs.
Second, the disparity in tax capacity reinforces the concentration of economic activity in Yerevan. While the central government attempts to offset regional inequalities through transfers, regions remain structurally disadvantaged due to their narrow tax base and limited revenue-raising opportunities. In contrast, Yerevan’s stronger tax capacity allows it to reinvest in infrastructure, public services, and development, further widening the gap. Finally, this fiscal structure weakens regional-level incentives to stimulate local economic growth. Without meaningful tax revenues, regional governments have fewer resources and motivations to invest in business development, infrastructure, education, or service delivery, perpetuating a cycle of underdevelopment and dependency.
This situation leaves local authorities without the necessary resources to invest in regional development. Moreover, many municipalities lack the technical capacity to design and implement development projects, resulting in underutilized grants. The absence of local revenue-generating tools and performance-based incentives further exacerbates regional governments’ fiscal challenges, hindering their ability to address the specific needs of their communities.
Institutional Causes of Disparity
The institutional structures in Armenia are highly centralized. With an unelected regional tier and governors at the marz (region) level appointed by the central government, there are no elections at the regional level; decisions on regional development are taken in Yerevan (at the local level), with very little local input. Even at the city level, municipal governments have almost no autonomy, and many services (for example, education, health care, and infrastructure) are operated under the control of national ministries. All municipalities have the same competencies under the law, regardless of their size; however, in practice, poorer communities often must rely on deconcentrated national agencies to provide basic services.
This centralized decision-making structure suppresses local initiative and responsiveness, as local councils and mayors have limited say over key investment allocations and social programs. Development decision-making is traditionally top-down, with national interests often dominating those of local communities. Consequently, areas outside Yerevan are often under-equipped to prioritize projects aligned with their development priorities.
Armenia’s institutional context offers little fiscal capacity for local governments to raise funds or motivate citizens to contribute. Grants based on performance and stable equalization systems are small. The financial equalization formula, adopted in 2016 to determine the number and volume of subsidies allocated to municipalities based on their needs, has been slow to take effect in practice, and local governments still rely on discretionary transfers. Moreover, municipalities remain largely unable to borrow or to seek alternative financing. While local governments can receive loans up to 20% of their own budget to make their plans, with the central government’s approval, this practice is rarely used due to strict conditions and poor creditworthiness.
The absence of fiscal tools, such as borrowing, performance-based grants, or municipal bond issuance, leaves local authorities with little flexibility to fund large-scale development projects. This lack of financial autonomy further exacerbates regional disparities, as poorer communities in the regions are unable to attract investment or finance essential infrastructure projects without central government intervention.
Without a coherent national vision for regional growth, Yerevan’s distance from the rest of the country has continued to widen. Despite other initiatives at various levels, notably the Territorial Development Strategy 2016–2025, there is no harmonized and integrated model of regional development. The lack of an integrated strategy means that, even when financial resources are available, they are often not used effectively or are concentrated in capital and a few urban centers.
Policy Recommendations
Addressing regional disparities is a complex, multi-layered problem that requires coordinated, simultaneous use of various policy tools and actions across sectors. No single policy alone can close the gaps in employment, human capital, and quality of life between Yerevan and the regions in a year or two.
First, we need to break out of the regional out-migration spiral or at least significantly slow it down in the short term. Our findings suggest that internal migration is best understood in the context of persistent regional disparities in employment opportunities, access to services, and broader economic prospects. Therefore, migration can be understood less as a discrete behavioral problem that needs to be addressed directly and more as a rational response by households to uneven local conditions. Below are a few policy approaches that could steer the dynamics in favor of regions if implemented robustly and systematically.
1. Strengthen Agricultural Productivity and Promote Modern Farming
Job market figures and analysis indicate that a significant portion of the regional population remains employed in agriculture, primarily on small-scale, low-productivity farms. While we clearly don’t suggest picturing a long-term regional development agenda solely in terms of agriculture, we see value in using it as a boost to regional development, focusing on promoting high-intensity agriculture and expanding larger, more productive farms.
- Emphasizing the implementation of climate-smart technologies, irrigation, and mechanization.
- Merging small plots where possible to reach economies of scale.
- Facilitating access to finance and investment, such as credit, subsidies, and technical assistance.
2. Improve Quality and Incentives in Regional Education
While infrastructure and facilities are necessary, teacher qualifications and the educational process remain the single most important factors in educational outcomes. To shrink the human capital gap between Yerevan and the regions, policies need to concentrate on:
- Attracting highly qualified teachers and university professors to regions with favorable salaries, significant performance-based incentives, housing conditions, and career advancement schemes.
- Providing professional support, mentorship programs, and continuous training for regional teachers to level up their qualifications.
- Complementing these efforts with investments in school facilities and learning materials to create a modern learning environment conducive to high-quality education.
For regional schools, retaining and attracting talented teachers will lead to better learning outcomes, reduce the brain drain of youth to Yerevan, and promote long-term human capital development, which is crucial for regional economic development.
3. Strengthen Healthcare Provision in Regional Areas
Disparities in access to healthcare, particularly the shortage of doctors and specialized medical services, continue to drive migration to Yerevan. Strengthening healthcare in the regions is especially important with the introduction of universal health insurance, which increases demand for services. Policies should include:
- Strengthening the healthcare team in regional hospitals through financial incentives, competitive salaries, and career support programs.
- Increasing the capacity of hospitals and clinics with modern equipment and infrastructure.
- The introduction of universal health insurance in 2026 is expected to raise patient flows to Yerevan. This creates an opportunity to support and strengthen regional hospitals by improving their capacity, staffing, and quality of care. By doing so, patients from regional areas will be more likely to seek care locally, thereby reducing overcrowding in the capital and increasing the accessibility and reliability of healthcare nationwide.
4. Leverage Regional Specialization through Targeted Risk-sharing Instruments
Regional financial outcomes in Armenia are strongly shaped by sector-specific developments. Financial policies should therefore align credit support with regions’ dominant sectors through sector-targeted risk-sharing instruments that reflect differences in business cycles and risk profiles. For example, agricultural regions would benefit from crop finance facilities and agricultural insurance that mitigate weather-related income volatility, while tourism-oriented or mountainous regions require loan products with longer maturities and grace periods to accommodate seasonal cash flows. More broadly, adapting credit guarantee schemes, interest support, and co-financing arrangements to the specific characteristics of key regional industries can reduce lenders’ perceived risk, enhance private financing, and significantly increase the effectiveness of financial support in narrowing regional disparities, without distorting underlying economic structures.
5. Improve effective access to finance by reducing information asymmetries through financial literacy
Despite broadly similar access to basic financial services across regions, effective access to finance remains uneven, reflecting information asymmetries that raise perceived risk, borrowing costs, and expectations of loan rejection outside Yerevan. Addressing these frictions requires targeted financial literacy and advisory programs that improve firms’ understanding of lending criteria, strengthen financial reporting, and support the preparation of bankable projects. By improving the quality and transparency of information available to lenders, such measures can lower risk, reduce self-exclusion from credit markets, and expand usable financing without relying on broad subsidies, contributing to more inclusive regional financial development.
6. Strengthen local fiscal capacity and incentives
Reducing regional disparities requires strengthening local fiscal capacity in ways that align incentives with economic development. This leads to a gradual expansion of locally retained revenues, enhancing fiscal autonomy and encouraging municipalities to actively support growth. At the same time, intergovernmental transfers should be based on more transparent, rule-based systems that reward economic activity, service delivery quality, and effective project implementation, rather than following a conservative, inertial pattern.
7. Build institutional capacity and improve regional governance
Fiscal decentralization and financial instruments will be ineffective without parallel improvements in local institutional capacity and governance. Many municipalities lack the technical expertise to design and implement bankable projects, which limits their ability to effectively utilize available funding. Establishing regional project preparation units to support feasibility analysis, cost-benefit assessments, and procurement would directly address this constraint. Strengthening regional-level accountability and representation would ensure that investment decisions reflect local needs and translate into durable regional outcomes.
Recommendations
Strategic, Cross-Cutting Recommendations
- Support a U.S.–Armenia Regional Development Compact that explicitly targets the Yerevan–marz gap, tying U.S. assistance to measurable improvements in regional employment, credit access, and service delivery using consistent indicators (e.g., wages, migration, nighttime lights).
- Fund a national regional data and monitoring platform (including satellite nighttime-light analysis and microdata capacity) to improve evidence-based policymaking and allow U.S. programs to evaluate regional impact consistently over time.
Finance, Private Sector, and Investment
- Expand USAID and DFC risk-sharing and credit guarantee facilities targeted specifically to regional SMEs, agriculture, tourism, and light manufacturing, reducing lender risk outside Yerevan, where perceived credit constraints are highest
- Support region-specific financial products, such as seasonal loan structures for agriculture and tourism, and crop or weather insurance mechanisms, particularly in northern and mountainous regions that are vulnerable to income volatility.
- Fund financial literacy and bankability programs for regional firms to reduce information asymmetries, improve financial reporting, and lower self-exclusion from credit markets, a key barrier identified in the report
Human Capital: Education and Workforce
- Support teacher and faculty attraction programs for regions through salary supplements, housing support, and career incentives, modeled on rural service programs used successfully in other middle-income countries
- Invest in regional vocational and applied STEM education hubs linked to local labor demand (agriculture technology, mining safety, tourism services, healthcare support), reducing youth migration to Yerevan.
Healthcare and Quality of Life
- Fund regional healthcare workforce incentive programs, including loan forgiveness, salary top-ups, and specialist rotation systems to reduce doctor shortages outside Yerevan, which are a key driver of internal migration
- Support equipment modernization and telemedicine infrastructure in regional hospitals to complement Armenia’s rollout of universal health insurance and reduce patient flow concentration in the capital.
Governance, Decentralization, and Institutions
- Provide technical assistance for fiscal decentralization reforms, helping Armenia expand locally retained revenues and design transparent, rule-based intergovernmental transfers that reward service delivery and economic activity rather than discretionary allocations
- Support the creation of regional project preparation units (PPUs) that help municipalities design bankable infrastructure and development projects, addressing institutional capacity gaps that currently lead to underutilized grants.
- Encourage performance-based grants tied to measurable improvements in employment, education quality, healthcare access, and project execution at the marz and municipal levels.
Migration and Regional Resilience
- Shift U.S. assistance framing from “migration control” to place-based development, recognizing out-migration as a rational response to uneven economic conditions rather than a behavioral issue
- Support pilot regional growth corridors outside Yerevan that combine finance, infrastructure, education, and governance reforms in a coordinated manner, demonstrating scalable models of balanced development.
Why This Matters for U.S. Policy
- Reducing Armenia’s regional disparities directly supports economic resilience, social stability, and border security, particularly in remote and frontier regions emphasized in the report.
- These interventions align with U.S. strategic interests in democratic governance, market-based development, and reducing structural drivers of emigration and instability in the South Caucasus.
Appendix
Table 1. GDP per capita by regions (marzes) of Armenia.
Source: Statistical Committee of Armenia.
| Region | GDP per capita (dram), 2020 | GDP per capital (% of national average), 2020 |
| Republic of Armenia | 2,087,423 | 100 |
| Yerevan City | 3,403,889 | 163.1 |
| Aragatsotn | 1,210,876 | 58 |
| Ararat | 1,633,810 | 78.3 |
| Armavir | 1,302,185 | 62.4 |
| Gegharkunik | 880,435 | 42.2 |
| Lori | 999,869 | 47.9 |
| Kotayk | 163,2263 | 78.2 |
| Shirak | 900,449 | 43.1 |
| Syunik | 258,2176 | 123.7 |
| Vayots Dzor | 1,362,290 | 65.3 |
| Tavush | 954,362 | 45.7 |
Table 2. Subnational Human Development Index, Armenia, 1990-2022. Source: Global Data Lab.
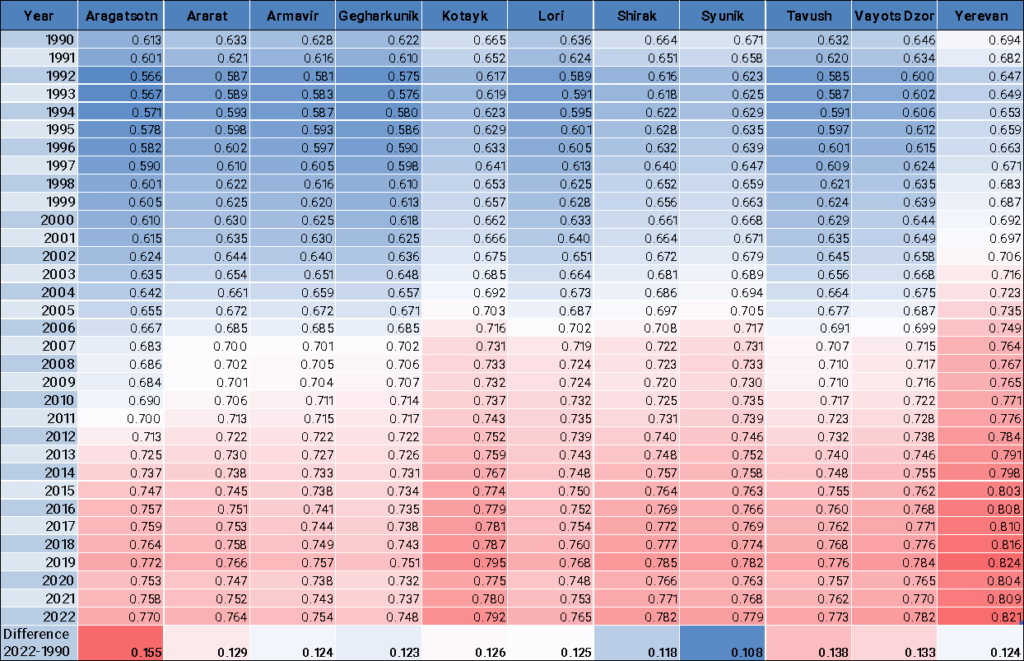
Table 3. Average market prices of apartments in multiple dwellings for a 1 m² area by cities of RA marzes.
Source: Statistical Committee of Armenia.
| Aragatsotn | Ashtarak | 206,400 |
| Aragatsotn | Aparan | 122,600 |
| Aragatsotn | Talin | 97,800 |
| Ararat | Artashat | 211,300 |
| Ararat | Masis | 218,500 |
| Ararat | Vedi | 168,900 |
| Ararat | Ararat | 160,800 |
| Armavir | Vagharshapat | 260,300 |
| Armavir | Armavir | 187,800 |
| Armavir | Metsamor | 153,600 |
| Gegharkunik | Sevan | 149,800 |
| Gegharkunik | Gavar | 106,200 |
| Gegharkunik | Martuni | 129,700 |
| Gegharkunik | Vardenis | 68,800 |
| Gegharkunik | Tshambarak | 49,300 |
| Lori | Vanadzor | 151,700 |
| Lori | Stepanavan | 93,600 |
| Lori | Spitak | 128,300 |
| Lori | Alaverdi | 67,000 |
| Lori | Tashir | 65,300 |
| Lori | Tumanyan | 26,800 |
| Lori | Aktala | 47,500 |
| Kotayk | Abovyan | 300,300 |
| Kotayk | Nor-Hachn | 209,300 |
| Kotayk | Byureghavan | 193,300 |
| Kotayk | Eghvard | 223,300 |
| Kotayk | Hrazdan | 142,400 |
| Kotayk | Tsaghkadzor | 447,700 |
| Kotayk | Charencavan | 154,200 |
| Shirak | Gyumri | 176,500 |
| Shirak | Artik | 96,800 |
| Shirak | Maralik | 73,200 |
| Syunik | Goris | 210,050 |
| Syunik | Kapan | 190,100 |
| Syunik | Sisian | 130,000 |
| Syunik | Meghri | 123,700 |
| Syunik | Qajaran | 141,000 |
| Vayots Dzor | Vayq | 132,200 |
| Vayots Dzor | Eghegnadzor | 171,800 |
| Vayots Dzor | Jermuk | 152,000 |
| Tavush | Dilijan | 214,150 |
| Tavush | Ijevan | 181,000 |
| Tavush | Berd | 110,200 |
| Tavush | Noyemberyan | 102,300 |
| Tavush | Ayrum | 63,300 |
About the Authors
Tatul Hayruni works on macroeconomic and public policy issues, with a focus on fiscal policy, public finance, pensions, and emerging market economies. He is an economist at the Central Bank of Armenia and has also consulted for the World Bank on applied policy research.
Naneh Hovanessian specializes in public policy and impact evaluation. She has experience working at the Central Bank of Armenia and collaborating with international organizations, including the United Nations, UNICEF, and the Asian Development Bank Institute (ADBI). She holds a master’s degree in economics from the American University of Armenia.
Edgar Hovhannisyan focuses on economic policy and trade, with a particular emphasis on monetary and macroeconomic analysis, as well as applied policy work in export promotion and international trade, including digital trade and services. He has worked with public institutions and international organizations, including the European Bank for Reconstruction and Development (EBRD) and the Asian Development Bank (ADB). He holds a PhD in economics from Yerevan State University and a MicroMaster’s in economics from MITx.
Lusine Torosyan works in macro-finance research and policy focusing on emerging-market economies. She worked at the Central Bank of Armenia and holds a master’s degree in international development from Harvard Kennedy School.
About the Institute
The Aram Manoukian Institute for Strategic Planning has been formed to work with experts in various fields to develop plans for the future of the Armenian nation in Armenia, Artsakh, and the Diaspora. The Institute’s overarching vision is to work towards creating a prosperous and just society in Armenia, Artsakh, and the Armenian diaspora, where the rights and dignity of all individuals are respected, and where peace, democracy, and sustainable development are achieved.
The Institute will identify appropriate target audiences, including government officials, civil society organizations, academia, businesses, and the public, to ensure its work reaches a diverse range of stakeholders. It will also build a diverse team with expertise from various fields, including academics, practitioners, individuals from the Armenian diaspora, and youth, to provide a holistic perspective in addressing the nation’s challenges. Additionally, it highlights the importance of forming partnerships and collaborations with government agencies, NGOs, research institutions, businesses, international organizations, and diaspora organizations to effectively leverage resources and knowledge. The Institute’s agenda will focus on pressing issues, including national security, economic development, education, good governance, healthcare, diaspora engagement, and environmental sustainability. By addressing these challenges through research-based insights and policy recommendations, the Institute will contribute to the betterment of the Armenian nation.
About the Institute’s Namesake
Aram Manoukian, born in 1879, was a prominent Armenian revolutionary who played a pivotal role in the formation of the First Armenian Republic in 1918. His educational journey began in local Armenian schools, followed by studies at the St. Petersburg Polytechnic Institute in Russia.
While still a student in St. Petersburg, Manoukian became deeply involved in the Armenian national liberation movement. In 1902, he formally joined the Armenian Revolutionary Federation (ARF) and actively participated in various ARF activities, including armed struggles against oppressive regimes in the Caucasus and the Middle East, notably the Ottoman Empire. He successfully led the self-defense of Van, saving the lives of tens of thousands of Armenian civilians from deportation and massacre by the Turkish government.
In 1917, after the Russian Revolution, Manoukian returned to Armenia and assumed a central role in establishing the First Armenian Republic in 1918. He served as the commander-in-chief of Armenian forces during intense battles against Ottoman forces in the Caucasus, ultimately securing Armenia’s independence.
Beyond his military leadership, Manoukian’s contributions extended to politics and economics in the nascent republic. As the prime minister, he championed social justice, equality, and progressive policies, focusing on land reform, education, and other measures to improve the lives of ordinary Armenians.
Today, Aram Manoukian’s legacy endures, serving as a timeless source of inspiration for Armenians, commemorating his unwavering dedication to his nation and his role as a patriotic statesman.